This is going to be another post about fun stats. If you aren't that excited about endless amounts of stats about my running, this post may bore you a little bit. You have been warned

Previously I wrote about calculating TRIMP, ATL,CTL and finding your Training/Stress Balance to determine your level of fitness vs fatigue in a way to calculate your performance level. A few weeks ago, I put in my entire training plan from the start of June through mid September with estimated guesses on my part to what TRIMP value those workouts would have based on previously similar runs that I had done. Once done, it mapped out what my Training season for my half marathon would like like in terms of fitness, fatigue and performance (TSB)
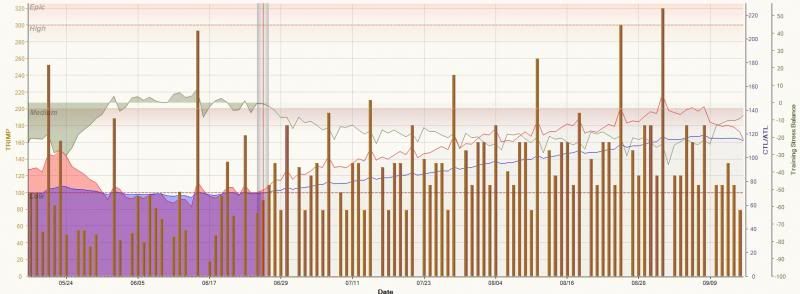
As a refresher, the Blue is CTL (or fitness), the red is ATL (or fatigue) and the Grey is TSB (or Performance level). TSB is measured up and down around the 0 line, where the higher above 0 the better, the lower below 0 the worse it is. For both Blue and Red, the higher it goes the larger the value.
You can see the end of my last training cycle that ended in May, the one that got me up to the 10k race level and helped improve my 10k PR time from 1:15:00 to 56:00 thus far (19 minute improvement from the start to the end). At the end of the training plan, my fatigue level had climbed pretty high from the amount of miles that I had been putting in (30+ a week for a few weeks), however in turn my fitness level had also been going up, albeit slower. The month of June was mostly keeping status quo. Keeping roughly the same level of fitness from where I had finished in May while keeping the fatigue down before I start my next training plan. Plus gives my body some time to rest and recover from the taxing May that I had. Now that it is time for the new plan, once again my fitness level will start climbing, but in turn so will fatigue. Both values will continue to climb until the first week of September where I begin to taper for the half marathon, allowing the fatigue to wear off prior to the race. This all depends on the calculated TRIMP scores that I put in for my workouts though. Thus far I overestimated most of those values as my improved fitness has allowed me to undertake these exercises with a bit more effeciency. The overall effect will still remain the same even if a slightly changed angle that my fitness and fatigue will both climb until September where I hopefully will be ready for the race.
I wanted to dig more into the various measurements regarding CTL/ATL/TSB and to better understand how my fitness level has been improving, and found a bunch of pretty useful information on a site that I have referenced before:
Running tips for everyone from beginners to racing marathons and ultramarathons
Jonathan actually has a plugin for SportTracks and a good deal of information regarding some of the data within it. Of course I dug into it and started looking over the data for my various runs. The more stats that he offered piqued my curiosity to start looking up the information and trying to understand the value in them. He has a graph page similar to my graph above that will measure out your CTL/ATL/TSB but he has four different methods of calculating it: TSB Model, Banister Model and Busso Model. Without going into a whole bunch of detail explaining the different models, here is his summary of the differences:
Comparison of the Models
- The TSB model is simpler than the other two models as it only has the two decay parameters.
- The Banister model has more experimental verification than the other models.
- The Busso model is the most complex, but is the only one that allows for Training Monotony.
Once I started looking more into what the Banister and Busso models had, it gave me a whole new slate of calculations or things to look at, exactly the type of thing I enjoy to dissect. With the plugin, I can actually pull up a page for each run that has a bunch of analytical data in it. I'll include my recent half-marathon relay race from Sunday as an example of this page.
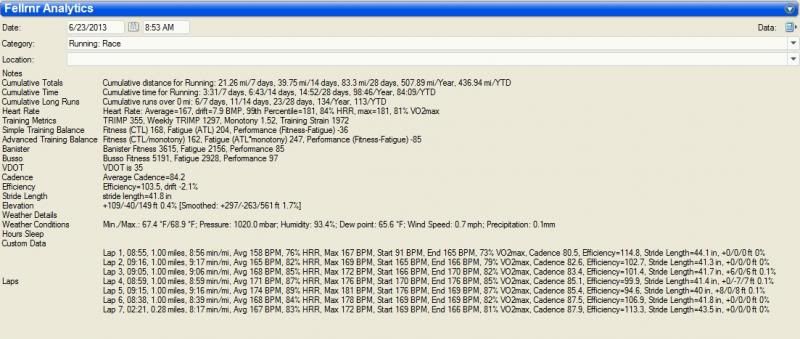
The first three lines are pretty self explanatory. The distance, duration and number of activities in the last week, 2 weeks, 4 weeks, year and year to date. So far in the 146 days this year, I've run in 113 of those days. When you factor in that I didn't run at all for most of January due to my back surgery, that means I have run a bunch this year so far
The next line is all Heart Rate data. Most are likely familiar with what your Avg heart rate and max heart rate during a run signifies. The higher your Heart rate, the harder your body is having to work to handle the pace/effort, weather conditions or terrain. During any moderate exercise of 10 minutes or more at 50-75% VO2 max, you'll start to experience cardiovascular drift. At a constant effort, your heart will reduce the amount of blood that it pumps and thus have to beat slightly faster to compensate and maintain the level of blood flow. This is due to many reasons, possibly dehydration, overheating or similar causes. Having a measurement for drift seems interesting, but there is another calculation that is covered later that seems to be a better measuring stick (Efficiency).
The next line gives information about TRIMP which I've talked about before so will gloss over here, but also has two new measurements for me, the monotony and training strain. The two go somewhat hand in hand together with monotony being one of the factors in calculating the training strain of an exercise. We all probably know by now that you can't do hard runs every single time out, eventually your body will just fall apart. It can lead to overtraining syndrome and be counter-productive. There evidently is also some thought that you need to change up your runs somewhat, by doing the same run repeatedly will lead to monotony and be counter productive as well. This goes for the same easy runs repeatedly as well. I had previously read something about that on strength-running blog as well but am not too versed with this line of thinking. The basic idea as I understand it is you can measure your training monotony by reviewing the previous 7 days of exercise. change in pace or distance helps break up the monotony as does rest days.
Quote:
|
Values of Monotony over 2.0 are generally considered too high, and values below 1.5 are preferable. A high value for Monotony indicates that the training program is ineffective. This could be because the athlete is doing a low level of training; an extreme example would be a well-trained runner doing a single easy mile every day. This would allow for complete recovery, but would not provide the stimulus for improvement and would likely lead to rapid detraining. At the other extreme, doing a hard work out every day would be monotonous and not allow sufficient time to recover.
|
Based on the above quote, my training monotony is 1.52 at the point of this run so I guess borderline getting too high. Looking through the measurements of last week, for most of the week my monotony score was below 1, and this week it is still around 1.57.. but that leads to the question of.. am I overtraining or undertraining? My guess is undertraining since I had been taking it easy a few weeks here. That is where training strain comes in though. It uses the monotony score along with the TRIMP score to give a strain score. The higher the training strain score, the more likely you are overtraining. His page does not give much in the way of specifics to what score would be too high as it is independent of the runner involved. Most of my training strain scores last week were 800-1000 and for this race I was closer to 2000. Still is that high? I am guessing not since my monotony is not near 2.0. I went back to look at the end of May to see where I was during my peak TRIMP days of my last training schedule and found that my strain was around 2200 most likely due to the monotony back then being lower. I think this will be something that I watch over the next 2 months just to see how I can use this calculation or better understand it.
The next three lines are the different calculations I wrote about above, and the following line gives me an easy VDOT score for that particular run. I have spoken about VDOT previously and I use it pretty religiously in setting my pace for the various runs that I do. For this race, my VDOT was 35. I tend to score a little lower VDOT on my 10k due to not having gotten a full grasp on my pacing yet. My 5k PR time that I actually use the VDOT from was a 37 score. Just as a point of reference for those just starting C25K, less than a year ago, my VDOT was below 30, so I have managed to improve it quite a bit this year.
Most of the other fields are pretty self explanatory.. Cadence, Stride Length, weather... But the one that I found very interesting was the Efficiency measurement. I wrote earlier in the paragraph about Drift that efficiency might be a better way of measuring your... well efficiency... I went to do some research on this one and kind of found it very interesting...
From fellnr's wiki once more:
Quote:
There are two components to running ability; fitness and economy. Fitness is the ability of our bodies to generate energy for running and is the focus of a lot of our training. Economy is how far and fast you can run with a given amount of energy. Good economy is a critical part of running, and Cadence is one element I focus on.
In an ideal world, wed be able to easily measure our Running Economy and see if things are improving. If we could measure our breath, find out how much O2 we consumed and how much CO2 we produce, wed know how much energy we burned (and from fat or carbohydrate). Sadly, this is not practical, so the best measure we have of energy consumption is our Heart Rate. This is far from perfect, as Heart Rate can vary for other reasons besides supplying O2 for energy production. However, I believe it is a useful approximation.
The calculated efficiency value cannot easily be used to compare different runners. It can be used as to track how your running efficiency is improving over time. Over the weeks and months of training your efficiency value should gradually improve. For instance, I've seen my efficiency go from 110-120 to 130-150 over a period of a few months. Sadly, I've also seen my efficiency dropped when I put on body fat (see Weight Loss and Performance.) This evaluation of my fitness this proved to be remarkably useful to me.
|
Before I go back to look at how my efficiency has improved over time, he also mentions that efficiency can also be looked at in the course of a single run to see how you are effected by glycogen being depleted during the activity. In my race from Sunday you can see in the lap splits that it includes the efficiency for each lap. You can see as my run continues, my efficiency decreases. I honestly don't know why the 6th and final mile was so different as it appears that I just sped up without increasing my Heart rate at all. Maybe I don't remember there being downhills there, or maybe adrenaline has an effect there.. I honestly do not know there... Using this over even longer distance though probably would be even more telling, especially if you go past the point of depleting your glycogen stores such as a marathon or 20+ mile distance.
Now to look at how I have become more efficient over time with my runs.. In his quote above, he says he went from 110-120 to 130-150 efficiency over the course of a few months. My Race on Sunday I was 103.5. Obviously he is going to be in better shape than I since he is an ultra-runner and has been doing it much longer than me. I wanted to see though how much I had improved over time. Since it relies on Heart rate measurements, I can only go back as far as I had a HRM earlier this year in Feb.. My early runs in Feb had efficiency of 89 (and a VDOT score of 24). Looking through several other runs, most of my scores were low 80s to low 90s, so I've improved by roughly 20 there in the last few months which I gather is a good sign.
None of this data really changed my impression of how I approach things with perhaps the one part that i want to read more about is training monotony.. however the ability to look at even more stats and numbers after a run just makes me giddy