As of today, the OS Account and subscriptions are officially live on the main site.
If you followed along last week, you already know why we’re doing this and how it works. Now it’s simply time to open things up and let you take a look.
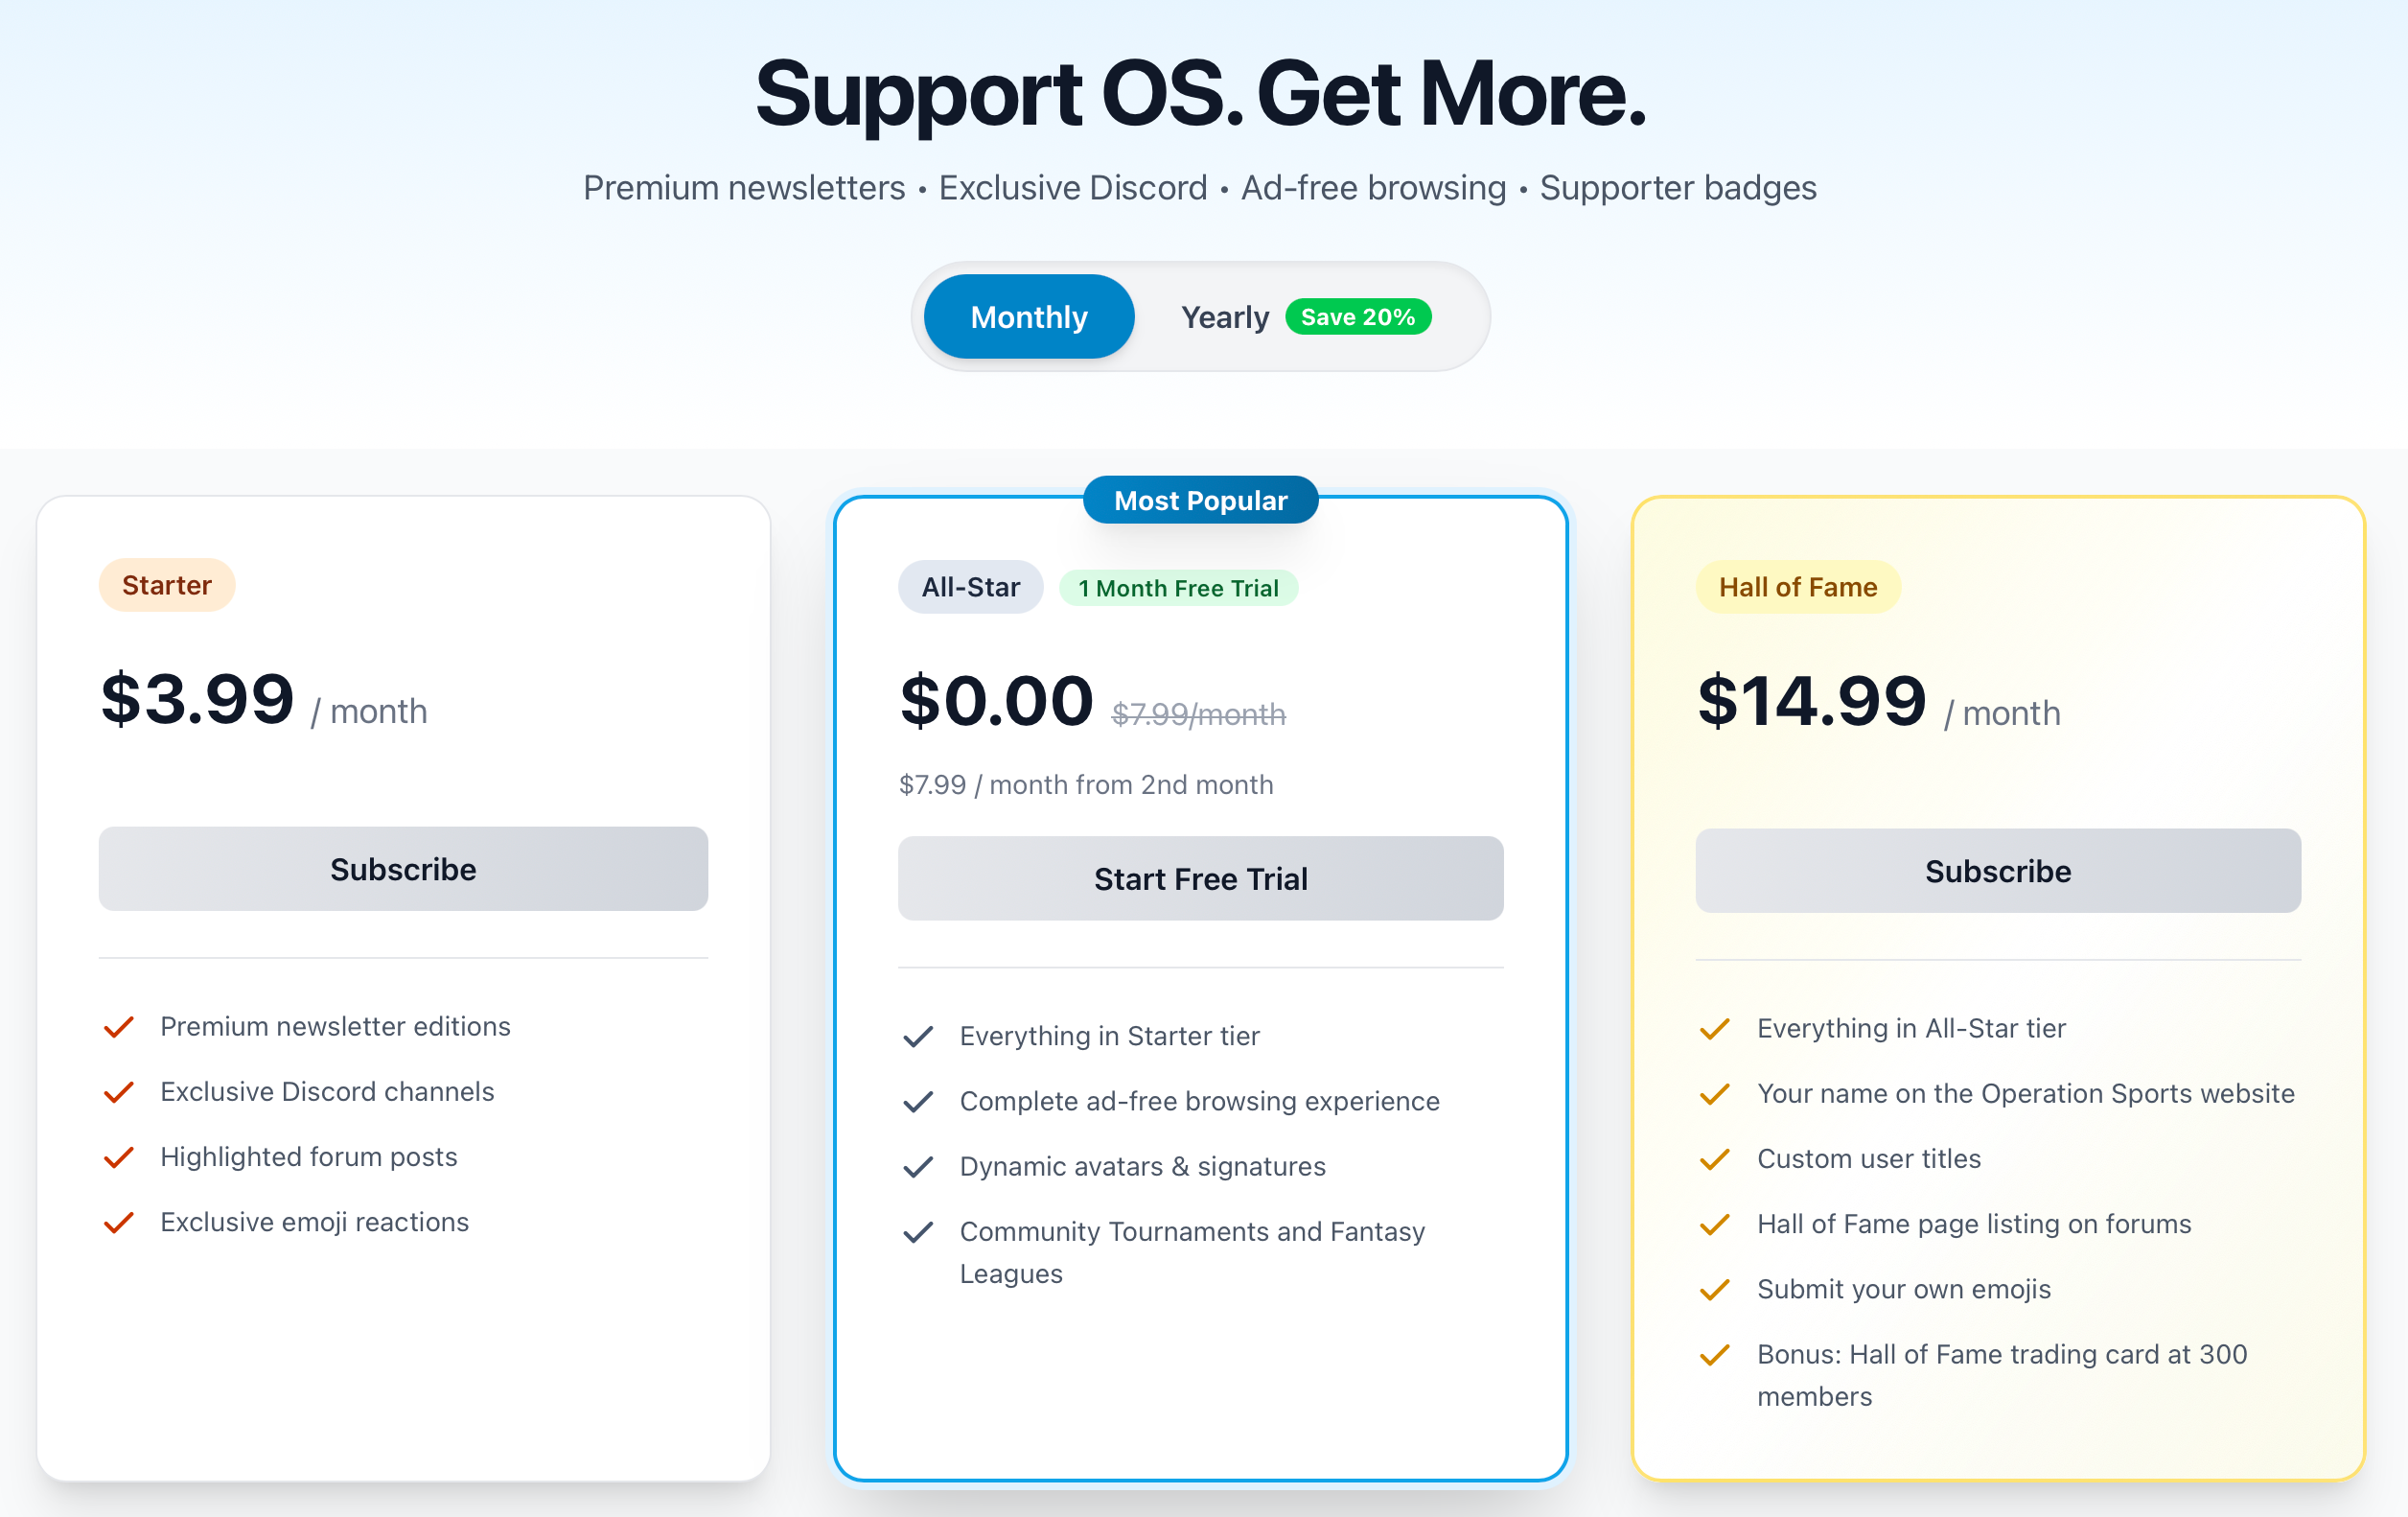
You can now choose between:
- Rookie, which keeps the free OS experience you already know
- Starter, for premium newsletter content and closer community access
- All-Star, for a fully ad-free experience, deeper forums experience, and access to community games
- Hall of Fame, for supporters who want to help shape what OS becomes next
You can explore all the tiers, perks, and details by registering your OS Account now.
For current premium newsletter subscribers, please note you’ll need to reach out to me on Discord (ChaseB) or email me at [email protected] with your current e-mail you use for the premium newsletter so I can get you listed as a Starter with your OS account (tell me what OS user name/email you’re using as well for that). Anyone who subscribes through Beehiiv moving forward will have an easier time connecting the two accounts, but it’s just a little tricky reverse engineering it for old subs, so we have to manually add you all.
Whether you decide to jump in now, later, or stick with free, the important thing is that Operation Sports continues to move forward in a way that’s community-first and independent.
For those who do choose to support OS through one of the paid tiers, thank you. You’re helping us:
- Build more directly for the community
- Invest back into the forums and features you care about
- Create new ways for the community to connect, interact, and hang out
- Reduce our reliance on ads and algorithms over time
This is just the beginning. There’s a lot we want to build next and now we finally have a foundation that allows us do that together.
Thanks, as always, for being part of Operation Sports.
-Chase


Comment