Re: Thread to show how the sim engine looks post patch
Originally posted by tlef316
Yeah.....whatever logic is behind picking Award Winners and all american/all conference players (plus the draft picks) is 100% totally busted. Really bad and really breaks immersion.
I'm playing on AA with 10 min quarters (accelerated clock). Even with tweaked sliders increasing my pass defense and lowering AI QB accuracy, I still struggle with giving up a LOT of completions and passing yardage. Most games i just play a bend but dont break approach and play a lot of zone....just trying to stretch out drives, limit big plays and get coverage sacks. (with the occasional turnover). I'm finishing up year 5 at Texas State and just made the playoffs for the first time (#12 seed.....squeezed in as the 5th highest ranked conference champ due an upset in the Big 12 title game. I was 14th in the rankings)
Despite being one of the worst passing defenses in the country nearly every year......all my starting DB's and even my package guys (3rd safety, 4th corner) are in the top 10 for the DB award.(and one of them wins it every year). They're not getting that many picks (I think my highest guy got 4 this year) so i think its solely because they're making a million tackles...because they're giving up so many completions.
Even with bumped up pass blocking for the CPU, my DL gets a lot of coverage sacks(I rarely control blitzers and never control DLmen off the snap) .....so my DL and LB's that play some DL in certain packages get all the relevant awards and often win the Heisman with 16 or 17 sacks. In 5 seasons I've won 3 Heisman trophies with D-linemen. And there are other DL at bigger schools with similar numbers....so there's no reason my guys should be winning.
This year my 2nd RB (who plays maybe 30% of the snaps, had about 350 rushing yards and maybe 400 receiving yards) was a first team AA and top 5 candidate for the RB award (my starting RB won)
So basically every year i win the RB award, the DB, DL, LB (mostly from sub package LB's playing DE on nickle packages) and DOPY awards. Won the Heisman 3/5 years with a sun-belt DE. And despite being the top candidates for all those awards, my defensive players are never first or 2nd team AA and rarely first team Sun Belt. And then, despite being rated in the low 80's.....they dont even get drafted in the 7th round.
Just totally broken. Clearly not even tested. Really a shame.
I haven’t had this experience with the running back but what you are saying about defensive players I’ve totally experienced. Another problem with defense is the way stats are tracked. Too many assisted tackles leading to too many total tackles (or not enough asst tackles in simmed games) and sacks counting as tfls in played games and not simmed games.
Re: Thread to show how the sim engine looks post patch
Originally posted by JayD
I just had a dynasty where Boston College won the Natty in year 1.........
Boston College, SMU, and freaking Charlotte are frequent overachievers in most of my test dynasties.
Favorite Teams: College #1: Michigan Wolverines College #2: Michigan State Spartans (my alma mater) College #3: North Carolina Tar Heels NHL: Detroit Redwings
Re: Thread to show how the sim engine looks post patch
Anyone have any idea why there is a big fall in 1000 yds rushers in year 2, 3, 4, etc. in Dynasty? Seems weird that the problem was improved in year 1 but then gets as bad as it was pre-patch in years 2, 3, 4, etc.
Based on the patch notes they improved the chances of teams running the ball that use RPO plays, I'm guessing that the fix doesn't work after year 1 of dynasty? The way it was worded in the patch notes, it appears like the devs see the issue and are willing adjust things if the data supports it, Canes your work is amazing at documenting this.
Re: Thread to show how the sim engine looks post patch
Could be a variety of things.
Do RB ratings plummet in future years?
Could we see what playbooks are generating the 1000 yard rushers in year 1 and then see how many of those playbooks are still in play in year 4?
And so on. Would love to see if anyone did track anything along these lines when testing things out.
In these years that the number of 1000 yard rushers took a dive, did passing numbers see the opposite occur, or did offenses just have overall less output?
Sent from my SM-S901U using Tapatalk
“No one is more hated than he who speaks the truth.”
Re: Thread to show how the sim engine looks post patch
Originally posted by canes21
Alright, all 5 season 1 simulations are done and compiled. I'll show those 5 individual seasons first, then what the numbers averaged out to between them all.
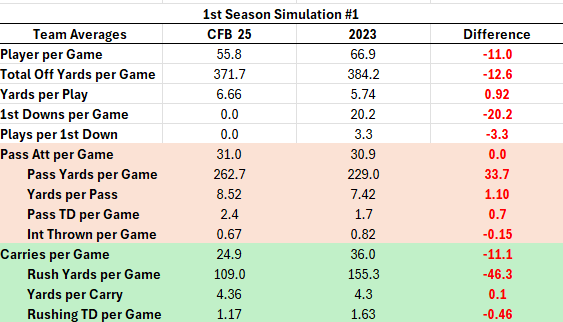
Season 1 Sim 1
Spoiler
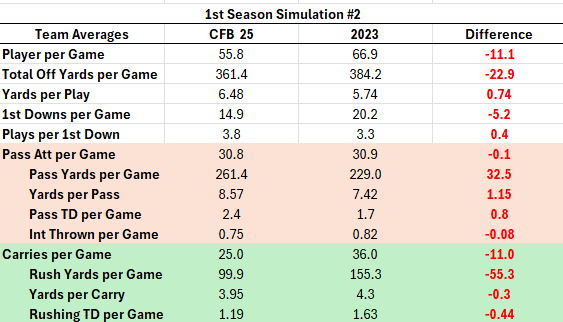
Season 2 Sim 2
Spoiler
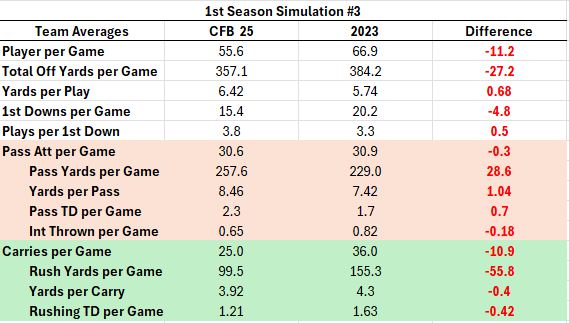
Season 1 Sim 3
Spoiler
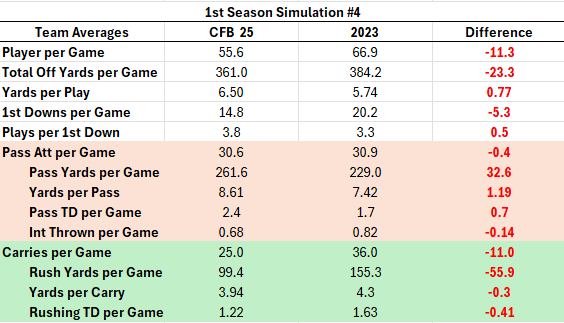
Season 1 Sim 4
Spoiler
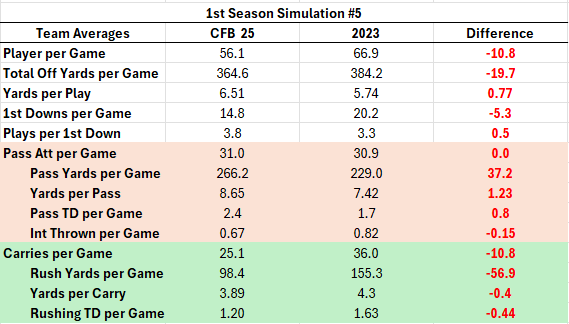
Season 1 Sim 5
Spoiler
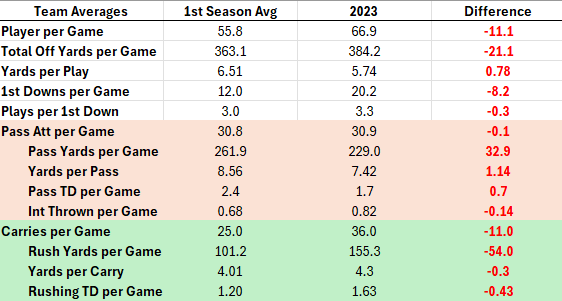
All 5 Simulations Averaged Out
First thing you'll notice is that the play count per game remains 11ish plays per team lower than what we saw in 2023 in real life. Given Madden has the same issue and both games are using the super sim engine, I think it's very possible this is an engine limitation that has the development teams' hands tied right now. Fortunately, we have the ability with our settings to change quarter lengths for played games, so we can at least get our snap counts in line with the simulated games.
What sticks out to me as the biggest issue in simmed games is the yards per play numbers and the run/pass ratios. You can see teams are throwing the ball more than they are running it, which is opposite of real life. And you can see yards per pass is more than 1 yard higher than real life which is a pretty decent jump up relative to the numbers we're discussing. It's also unfortunate that the tuning made to get more handoffs on RPO plays in simmed games doesn't look to have really caused an uptick in attempts, but did drop the yards/carry down by about a quarter of a yard. If you remember my first stats compilation pre-patch, the yards per carry were pretty much money, and in my 1st simulation here they were very close as well. It's the fact that in the other 4 simulations they were .3 to .4 yards lower than real life and given that's around 10% of the figure we're talking about, that's a decent amount.
As a result of these yards per attempt issues both in the air and on the ground, yards per play overall are off by a little under a full yard, or around 13%, which I personally feel is significant relative to the numbers we're looking at. Given the play call ratios in simmed games along with the higher yards per pass attempt numbers, that's going to naturally inflate yards per play overall like we're seeing. If we simply took the run/pass ratios from real life and applied them to simmed games and left the yards/attempt where they are, we'd see the overall yards/play number fall to 6.1 which is a lot closer to real life.
Ultimately, the issue here is that passes in simmed games are going too far on average. I don't know if this is an issue with YAC in the sim engine or a target depth issue in the simmed engine, but something is causing the yards/attempt to be too high. And, I bet given what I do know about the sim engine, trying to tune that number to be more in line with real life is going to introduce multiple other issues and become a headache.
The TD distribution is also noticeably off compared to real life, but again, this is easily explained by the run/pass ratios. If those were more in line, the TD distribution would be much closer to real life.
When looking at all of this on a macro level, I think the biggest issue with the simmed stats, especially if we're hard capped at around 55-56 plays/game by each team, is the run pass ratios. I'm wondering if these ratios were a design choice to get passing stats to look more like real life in volume and the rushing stats and yards/attempt had to be sacrificed to do so. If that's the case, I understand why it was done. It's not ideal, but I see the logic.
You'll also notice that I threw in 2 new stats in tracking 1st downs per game along with plays per 1st down gained. I did this fully expecting plays per game to be lower than real life by about the amount they are. However, I wanted to see if the amount of plays between 1st downs was similar to real life and it is actually very close. 1st downs are gained slightly quicker in simmed games than real life, but that's easily explained away by the increased yards per play average brought on by the higher yards per attempt along with the run/pass ratios.
Nothing really notable to say there other than if the run pass ratios were more accurate to life, then the number of plays between 1st downs on average would basically be spot on, so good job there to the sim engine team. They did a good job getting a lot of these numbers close to accurate, it's simply the run/pass ratios and yards/attempt that are really the biggest issues and the root of most differences, big or small.
I will end this post here for now. This was just a macro look into everything. I still plan to take one of these files and sim to year 5 and then compile all that data, but this takes a long time to do given I have to go team by team and add up all the attempts and enter all this into excel manually. If I had a way to export data, that'd be a time saver. Heck, if the team stats page just showed rush and pass attempts, that'd make this significantly quicker. But it doesn't, so I have to go in and manually add up all the rushing totals, all the pass attempts for teams that had multiple QB's play, and so on, so it gets a bit draining.
Before I come back with the future season stats, I probably will look at these season 1 numbers in a bit more detail. I'd like to look more at how much teams are deviating from one another in multiple areas compared to real life. Like I did with my original stats post shortly after release, I'd like to see what the top 10 teams in total plays looked like vs the bottom 10 and how big the variance is between teams. Same for rushing attempts. Are the top rushing teams running the balls are higher frequencies close to real life or are they even passing the ball too much in simmed games compared to real life.
It shouldn't be too hard to figure all that out, but I didn't want to make this post any longer than it already is. Sometime tonight or tomorrow I'll probably be back with the more in-depth look at the season 1 sims, then over the weekend I may do the future seasons sims and compile that data if I'm not too engrossed in my dynasty instead.
Also, just want to apologize for any spelling or grammatical errors above. I type fast, I hardly reread what I write, and I am a numbers guy, not a words guy.
Great information canes! Trying to get stats that mimic 2023 FBS is great but we’ll certainly be better served, long term, by trying to mimic the sim engine. Doing my own FBS deep dive into interceptions and seeing the worst team only threw 1.6/game and the national average was 0.8 was eye opening to me.
I think in your slider thread you had 9 mins/20 sec run off is what to use to get closer to sim engine numbers so I’ll be running with that moving forward!
Re: Thread to show how the sim engine looks post patch
Just finished my first season of my real dynasty, and I had 18 1k rushers, and another 11 that had 900+ yards (3 of which were within 20 yards of 1k). That’s not bad.
Favorite Teams: College #1: Michigan Wolverines College #2: Michigan State Spartans (my alma mater) College #3: North Carolina Tar Heels NHL: Detroit Redwings
Re: Thread to show how the sim engine looks post patch
This isn’t a bad thing, (I think the bracket actually looks good) but it’s a funny coincidental thing as you’ve got 5 B1G teams making it, but they’re all in the same half of the bracket. What’s more, on the top you’ve got the Texas invitational. So you’ve got the Texas regional and the B1G regional.
Favorite Teams: College #1: Michigan Wolverines College #2: Michigan State Spartans (my alma mater) College #3: North Carolina Tar Heels NHL: Detroit Redwings
Re: Thread to show how the sim engine looks post patch
Originally posted by fightingirish595
Now if only we could test this hypothesis with custom rosters
It wouldn't work with custom rosters alone. The game is tuned for this current rating spread. If we were to make custom rosters to make them align with that spread it would break things.
We can't change the rating spread by rosters alone; the gameplay code would need to be adjusted as well.


Comment