Hey everyone,
We’re excited to announce that we have launched our own official Operation Sports app. It’s available on the iOS App Store and in the Google Play store:
For those of you who have been around these parts for quite some time, you might know we’ve had an app before, but the Tapatalk app was not “official” and was only a way to look at the forums on your phone. However, when the forums changed in any way, it would make that app a bit unwieldy/buggy.
It was still better than nothing, and we’re grateful it lasted as long as it did, but we did not have much control over it or ways to update it. With our own official app, we’ll be able to actually release app updates that can include new features and bug fixes.
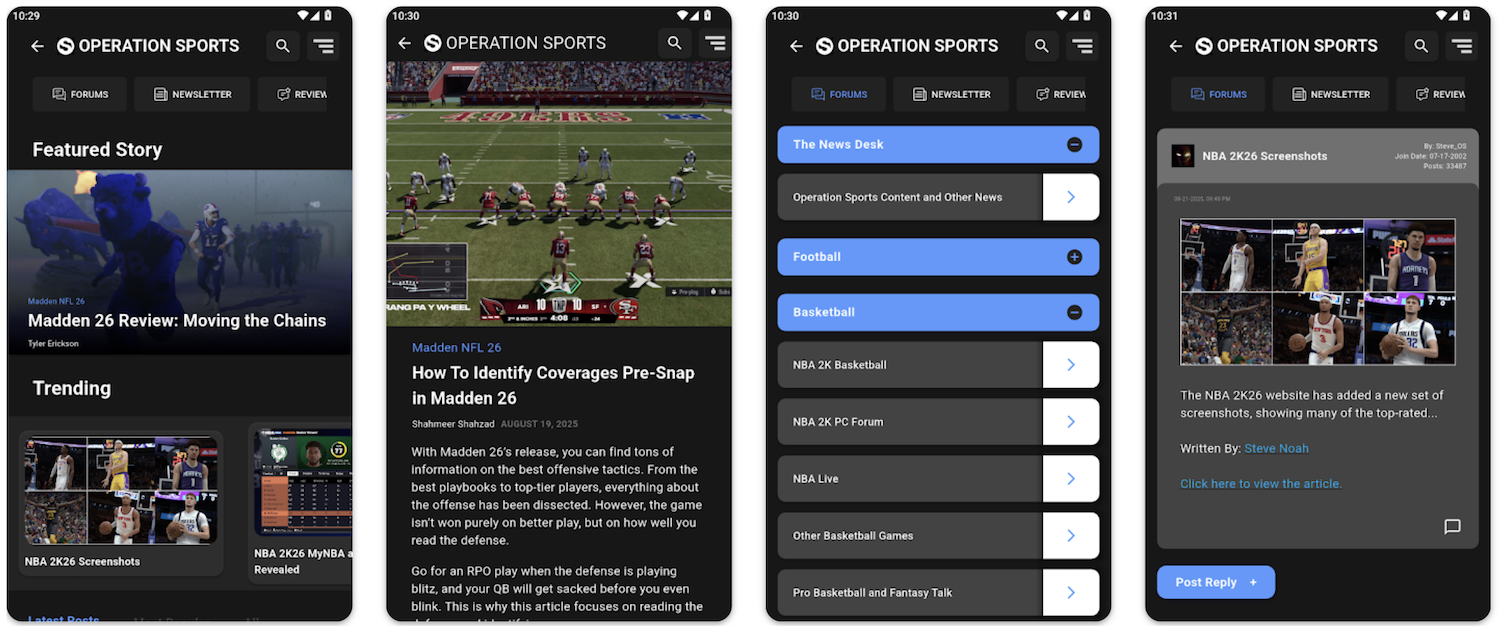
On the app, you will be able to scope out both the front page and the forums. Since this is only the start of the app, we are aware of many known issues, particularly around the forums, and we plan to add more to it in the future based on your feedback. In addition, it may take a little longer than usual when you log-in for the first time, but it should not be the case after that initial log-in. With all that in mind, we’ll have a spot on Discord where you can provide feedback.
For example, I want to add more to the forums side of things so you all have more options when making posts and threads on the app, and I want you to more easily be able to navigate large threads with many pages of posts.
As always, we can’t do any of this stuff without you all, so thanks again for the continued support. This app along with the Discord are a couple of the steps we have taken recently to try and bring this community together in as many ways as possible, and we plan to deliver even more on that front in the months ahead.


Comment