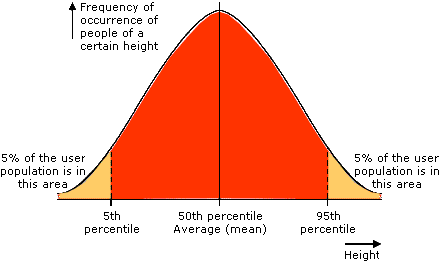
My job is to find out the frequency distribution for each in-game tendency, in order to improve the CPU decision making. I want to find the p25, p50 and p75.
p25 = percentile 25, 25% chance of occurence
p50 = percentile 50, the median, 50% chance of occurence
p75 = percentile 75, 75% chance of occurence

Why do we need this ? Because in statistics this is called a normal distribution. It represents very well real-life behavior, and here the CPU decision making.
By distributing tendencies values around the p25 and the p75 we are going to have smart players, with strenghts and weaknesses, as we see in NBA.
I want to avoid as much as possible extremes values (basically 0 or 99) because it leads to robotic decision.
Indeed with extremes values, the CPU won't have the possibility of choice, it will do the tendency as soon as he is in the situation to do so.
For instance, a player with a 99 stepback3 tendency will do a stepback3 as soon as the situation can trigger a stepback3.
This is dramatic in term of decision making where we want players to think, to choose, if the move is appropriate or not.
Therefore I will provide you with a big table of every in-game tendency, and for each we want :
-minimum value
-p25
-p50
-p75
-max value
-description
-concrete example
Please share if you have any suggestions or remarks, and if you want to contribute to this project :
https://docs.google.com/spreadsheets...it?usp=sharing
Everyone is able to modify the figures if you have better statistics or others remarks.
PS : there is also a thread for MyStaff for those interested to go deeper in the realism (https://forums.operationsports.com/f...-creators.html)


Comment